Jul 22, 2007

Summer Doldrums Over?

The HUI has signalled a decisive breakout right in the middle of the "Shopping Season" spoiling everyone's vacation:

Click to see magnified


It remains to see if gold will confirm following suit behind the stocks and propped by the weakening US dollar (Which is looking very precarious at 80-something points. It shouldn't surprise us if the buck "stages" a temporary comeback..):

Click to see magnified

Labels: , ,

May 1, 2007

Steve Saville: Gold Stocks' Leverage (or lack thereof)

Gold Stocks' Leverage (or lack thereof)
by Steve Saville


Below is an extract from a commentary originally posted at www.speculative-investor.com on 29th April 2007.

Most people involved in the gold sector would realise that over the past few years gold stocks, as a group, have failed to live-up to their reputation as leveraged plays on the gold price. They provided substantial leverage to gains in the gold price during 2001-2003, but during the most recent 3.5 years of the gold bull market an investment in gold bullion has out-performed an investment in the AMEX Gold BUGS Index (HUI). Given that gold stocks are much riskier than gold bullion, this begs the question: why invest in gold stocks?

Before answering the above question we'll take a look at why gold stocks have performed relatively poorly since late-2003 and see if the historical record offers any clues as to what might happen in the future.

We think the following chart-based comparison of the yield-spread (the 30-year interest rate divided by the 5-year interest rate), the gold/GYX ratio (gold relative to a basket of industrial metals), and the HUI/gold ratio contains the reasons for the relatively strong performance of the gold sector during 2001-2003 and its relatively weak performance thereafter. The chart shows that as the yield-spread widened (as short-term interest rates fell relative to long-term interest rates), gold trended higher relative to industrial metals and the HUI provided substantial leverage to gains in the gold price. However, the ability of gold stocks to leverage gains in the gold price evaporated when the yield-spread began to contract and gold began to under-perform the industrial metals.

The crux of the matter is that during 2001-2003 the financial markets were responding to economic weakness, falling liquidity and aggressive rate-cutting on the parts of central banks. In this environment the yield-spread widened and counter-cyclical gold did well relative to cyclical commodities such as the industrial metals, causing the profit margins of gold miners to expand. However, by late-2003 the markets had begun to discount stronger growth, leading to increased financial market liquidity and strength in cyclical commodities relative to counter-cyclical gold. The rising liquidity tide ended up lifting all boats including the golden boat, but in this environment the profit margins of the major gold producers contracted as the cost of mining gold increased faster than the gold price. As a result, gold stocks performed poorly on a relative basis.

It is also worth mentioning that whereas the aboveground supply of gold increases at a slow and steady 1.5-2.0% per year, year-in and year-out regardless of what is happening to the gold price, a gold bull market invariably leads to a rapid increase in the supply of gold shares. As the gold bull market becomes more widely recognised the rate of increase in the supply of gold shares tends to accelerate due, firstly, to the arrival on the scene of many new gold mining companies and, secondly, to most managers of small gold mining companies being embedded with a gene that prevents them from saying "no thanks" when presented with the opportunity to raise money by issuing more shares. In other words, the supply of gold bullion is severely constrained whereas the supply of gold shares can be -- and usually is -- expanded rapidly in response to rising demand.

Interestingly, the performance of the gold sector relative to gold bullion during the current bull market is not dissimilar to its performance during the bull market of the 1960s and 1970s (the gold price was fixed at $35/ounce prior to 1971, but the performance of the gold sector of the stock market indicates that a gold bull market actually began in the early-1960s). Specifically, the following chart of the BGMI/gold ratio (the Barrons Gold Mining Index divided by the gold price) shows that relative to gold bullion the major gold stocks peaked in 1968 and then trended lower for the next 12 years.

The above chart should give pause to those who believe that a drop in the HUI/gold ratio or the XAU/gold ratio to a particular level automatically means that it's a good time to aggressively buy gold stocks. Today's secular gold bull market is probably going to continue for many more years, but if it follows a similar pattern to the previous secular bull market then the major gold stocks will move much higher in nominal dollar terms over the next several years while moving lower in gold terms.

We'll now return to the question: why invest in gold stocks?

As we've said numerous times in TSI commentaries over the past few years, we don't think there is a good reason to favour the MAJOR gold stocks over gold bullion. There will be periods when the large-cap gold stocks trend higher relative to the metal, especially those periods when the yield-spread is widening and gold is out-performing industrial commodities. Such periods will offer opportunities to go 'long' these stocks for intermediate-term trades, but we think long-term investors will be better-served by the bullion. In our opinion, the large-cap gold stocks do not offer enough upside potential, relative to gold bullion, to warrant long-term investors taking-on the additional risk inherent in the stocks.

However, junior gold stocks in general and exploration-stage gold stocks in particular are a different 'kettle of fish'. Despite their risky nature, there are plenty of stocks at this end of the market that have sufficient upside potential relative to the bullion to enable a good case to be made for accepting the risk (*blogger's emphasis). Of course, speculators in these stocks must be emotionally equipped to handle high volatility and must diversify to mitigate the effect on the portfolio of a big problem with any single stock.


Steve Saville
Hong Kong

Labels: , , , ,

Apr 12, 2007

Enrico Orlandini: gold is on the threshold of an explosive move to the upside

"Gold is one of my favorite subjects and I can never get enough of it. The June 07 Gold futures contract went into the Easter holiday at 679.4 and that is a new closing high for this leg up. Some months back I advised you that gold was going to a minimum of 775.0 before we would run out of steam and nothing has changed my mind. I also told you that we would have two 7% corrections and that is just what happened. Now I am going to tell you that gold is on the threshold of an explosive move to the upside; the type of move where you could see an advance of 100.0 within a seven to ten day period. We have overcome good resistance at 667.1, 672.5, and 687.0 is the next target followed by a test of the significant Fibonacci resistance at 696.0. It was this resistance that turned back the last rally but I don't think it will stop gold this time around. Here are the magic Fibonacci numbers with respect to the June 07 gold futures contract:
GOLD'S SUPPORT GOLD'S RESISTANCE
623.3 696.0
649.3 721.7
672.5 746.3

The 775.0 resistance number I referred to earlier is with respect to the spot price for gold and it should be enough to stop the current leg up, but that doesn't mean that it will. As usual, I like to put gold's activity into perspective and the best way to do that is to view the historical chart:

This entire rally is nothing short of spectacular and what is even more fascinating is that the best is yet to come. You can see the May 2006 high of 732.0 and we are now within shouting distance ten months later. If there is one thing that makes me believe that we could go higher than 775.0, it is the fact that we have been consolidating gains for ten months. That could/should provide a powerful base for rally that may go well beyond 775.0 and could even challenge the all-time high at 882.5 but we'll just have to wait and see.

Silver, and to a lesser degree gold stocks are following in gold's footsteps. The May Silver futures contract closed up 12.0 at 1374.0 on Thursday and that is a new closing high for this leg up. Like gold, silver has a set of important Fibonacci numbers as well. They are as follows:

SILVER'S SUPPORT
SILVER'S RESISTANCE
1,328.1
1,389.6
1,358.7
1,423.6
1,456.0

In all honesty, I see more upward potential in silver right now than I do in gold and the following P & F chart for silver tends to agree with me:

We have a bullish price objective of 21.5 and that is slightly above my 20.73 objective and more than 40% above Thursday's close. Silver appears to be leading gold at this point in time while gold stocks appear to be following both; or maybe dragged would be a better word. On Thursday the HUI closed down 1.87 to end the week at 354.15 and that is just below good Fibonacci resistance at 354.84. There is good Fibonacci support at 351.59 and 336.11. I have been vacillating about the future of gold stocks to the point that I sold 25% of my portfolio some weeks back. I still hold the same portfolio that I bought in September 2004 and it is as follows:

BUENAVENTURA (BVN) = 20%
COEUR D'ALENE (CDE) = 5%
GOLDCORP (GG) = 15%
NEWMONT (NEM) = 10%
ROYAL GOLD (RGLD) = 20%
SILVER WHEATON (SLW) = 5%
CASH = 25%

Actually the cash component is a bit misleading as I used it to but gold on the futures market. Take a look at the following weekly chart of the HUI:

I have been wondering for weeks now if the HUI will follow gold up or the Dow down. As of today I do not have a definitive answer but as you can see above, the HUI is being compressed into a tighter and tighter range with a series of higher lows and lower highs. We are coming to a crucial moment in time where there will be a breakout in one direction or the other. Given the fact that this is a bull market, the odds heavily favor a breakout to the upside but the fly in the ointment could be the Dow. If the Dow rallies until mid-June than I suspect new highs will be made but if the Dow turns down this week, it might be a different story. We'll just have to wait and see. In the meantime I am long gold, silver, and gold stocks and that will not change."

Click HERE to read entire article

Labels: , , ,

Feb 14, 2007

Still a Golden Opportunity to Buy Gold Shares?

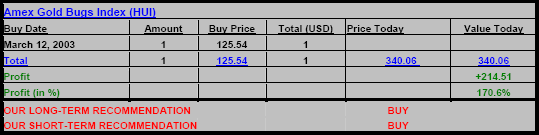
The following article from Peter Zihlman of the P. ZIHLMANN INVESTMENT MANAGEMENT AG and appeared yesterday on the Gold Eagle website:

The AMEX GOLD BUGS INDEX (HUI):
Still a Golden Opportunity to Buy Gold Shares?
Follow-up No. 6
Peter Zihlmann
February 13, 2007

The Long-term Picture

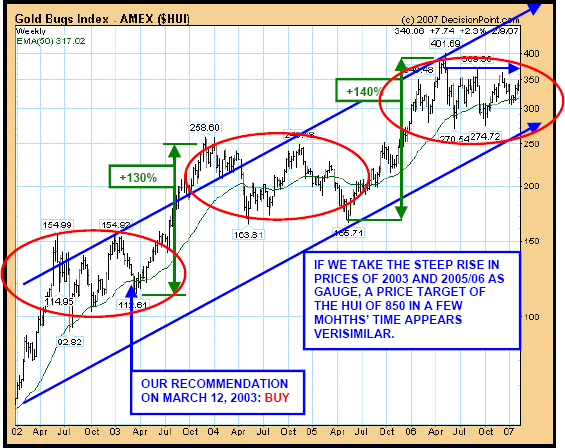
The two lengthy consolidation periods within this solid long-term up-trend shown in the chart above in red circles reveal in fact striking similarities. One similarity e.g. is the surge of the Index by more than 100% before the inevitable movement of consolidation began.
If the past is admitted as a guide to the future, we can deduce how far the market may rise during the up-swing which is currently in the making.

Investors who have been waiting for almost a year to see their purchase prices again, have a tendency to get out once they can get out even and often miss for this reason the ensuing chance to make a substantial profit.

"Therefore, we should keep our fears in check and ask ourselves without emotions where the market may lead us. In our opinion, it is of course only possible to indicate a range within which this movement could end, and we would place our Index target between 350 points as a minimum and 430 points as a maximum before a further consolidation phase starts.", we wrote on September 20, 2005, while the Index stood at 237 point. As we now know the Index did in fact peak at 401 points.

As we are in similar situation as in September 2005, we venture at present to set new target range, namely of 680 to 850 points.

The Medium-term Picture

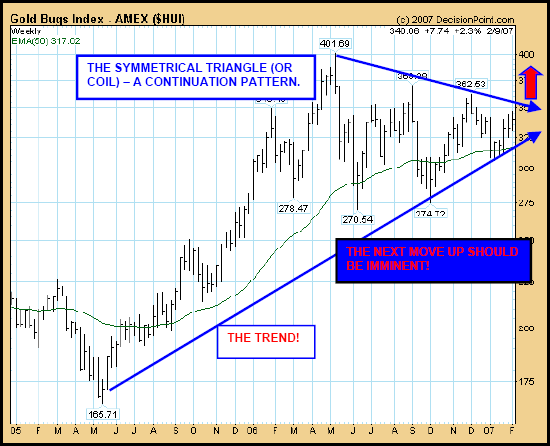
The symmetrical triangle, which can also be referred to as a coil, usually forms during a trend as a continuation pattern. The pattern contains at least two lower highs and two higher lows. When these points are connected, the lines converge as they are extended and the symmetrical triangle takes shape. You could also think of it as a contracting wedge, wide at the beginning and narrowing over time.

While we may have to wait a little while till the Index jumps out of the triangle, we believe that purchases of selected shares should not be deferred.

The Short-term Picture

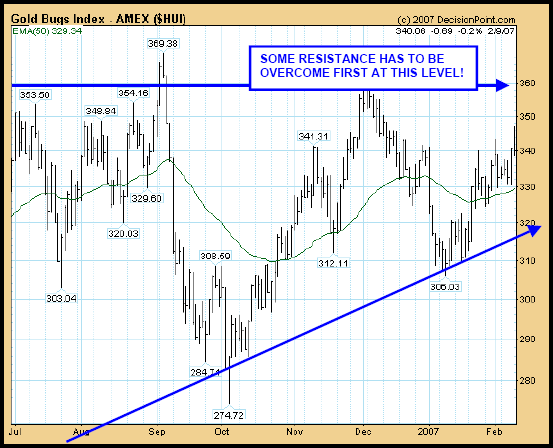
This short-term up-trend started early this year suggests that the market may have a bit of resistance to overcome before it will take off decidedly.

It may however prove to be expensive to wait for a short-term correction as, first, we are in a secular bull-market and, second, we are just coming out of a lengthy consolidation which is drawing to its end.

In the 1970s, the most admired technical analyst was Joe Granville. In fact, for a brief period of time Granville's buy and sell signals would move the US stock market - at least temporary. Granville's demise as a market guru then followed. In 1982, he failed to realize that a secular bull market in bonds and stocks had begun and remained bearish.

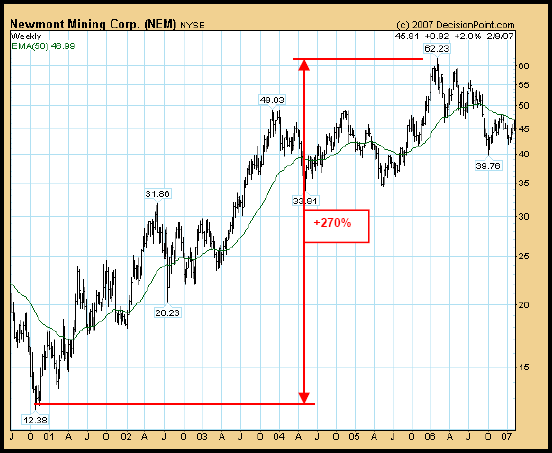
There are many ways to participate in this unfolding next leg up in the secular bull-market of precious metals and the corresponding shares. One way of course is to simply buy the industry's leader, like Newmont Mining, shown in the chart below. You would have made 270% if you bought at the bottom.

Medium sized companies and juniors however offer a lot more leverage to the gold price but are also riskier.

Another way of participation is through an investment fund that primarily invests in mid-sized and junior companies like THE TIMELESS PRECIOUS METAL FUND (+61% in 2006) .


We also offer Portfolio Management services for clients who prefer to have their individually managed precious metals portfolios:
www.pzim.com
investment@pzim.com
invest@pzim.ch Tel.+41 44 268 51 10
Mobile +41 79 379 51 57


Labels: , , ,